Hey Southern California! It’s time for our monthly Southern California Real Estate Market report where we provide you with the latest and most accurate real estate market updates for the Southland. Today, we’ll be sharing market data for the month of June 2024, which is the most recent data available.
In this month’s report, we’ll be focusing on the key statistics that reflect the current conditions of the real estate market in San Bernardino County:
- Average Sales Price
- New Listings
- Active Listings
- Pending Sales
- Closed Sales
- Average Days On The Market
- Months Supply of Inventory
I keep a close watch on these stats to understand our current position in the market. While they may give us some idea of what’s to come, predicting the real estate market is always a bit uncertain. I’ll also provide some historical perspective, which may give us an indication of future trends, but it’s no guarantee of what’s to come. So, let’s take a closer look, shall we?
Overview
In most areas, the real estate market has continued to perform well in the month of June. Home prices have increased, there is high activity, and buyer demand remains strong despite mortgage rates holding steady at around 7%. However, sales and inventory continue to trend downwards as they have been for some time.
Now, some people might worry about the real estate market due to values going up while sales are down. My our goal is to provide you with the real truth about why these things are happening and to equip you to make informed real estate decisions.
Whether you’re considering selling, buying, or staying put, I’ll present the numbers and provide you with context to help you understand them. Contrary to concerns, the real estate market is not in trouble, at least not in the near future. We’ll delve into the details of why sales are down and the inventory of homes for sale in the rest of this article.
Let’s dig into the numbers – I know you’re eager to get to that! We’ll be looking at San Bernardino County and Riverside County separately, here is the link to the Riverside County Market Report for June.
San Bernardino County Average Home Prices
We’ll begin with this metric as it’s the one thing that most people are interested in, and rightly so. If you’re a seller, you want to know how much you can get for your house. If you’re a buyer, you want to know where you stand in terms of your buying possibilities.
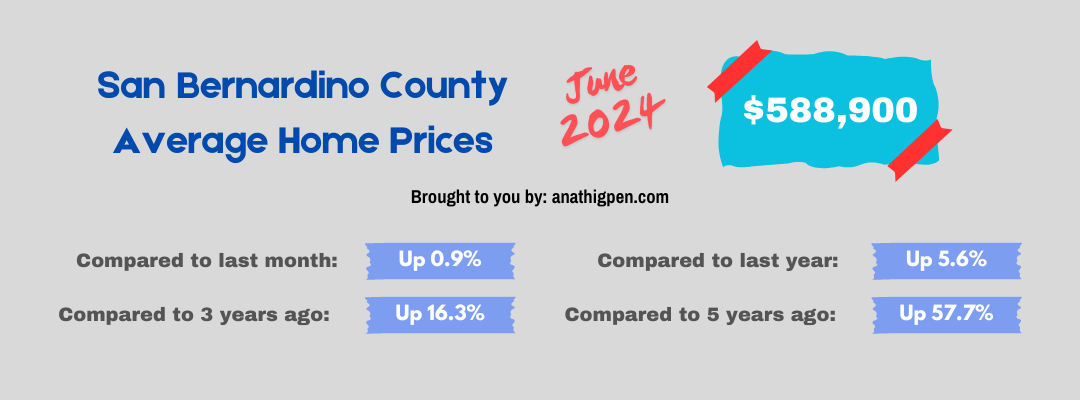
In June 2024, the average sales price of a home in San Bernardino County was a healthy $588,900, according to the local Multiple Listing Service. This was up 0.9% from last month and 5.6% from a year ago.
San Bernardino County New Listings
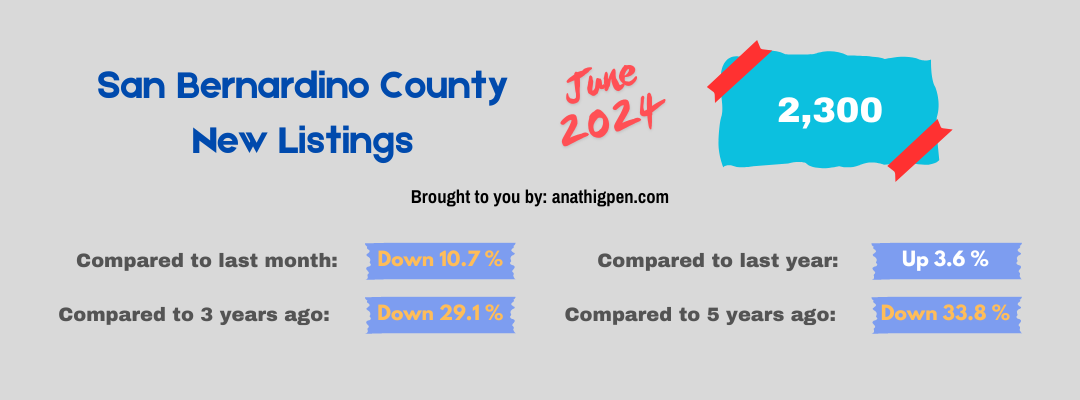
This is where it starts to get interesting. In June 2024, there were 2,300 new listings, about 11% less than the previous month, a slight uptick from last years BUT, here are the numbers that tell a BIG story. Listings are down about 30% from 3 years ago and 5 years ago. AND, 37% down from the historical average number of listings over the last 16 years!
So what do these numbers mean? As I mentioned in the beginning, understanding these numbers at a deep level is critical if you want to really know what’s going on in the market. Listings are down quite a bit historically speaking. In large part because seller’s don’t want to give up that cush 2.75% mortgage rate they have on their 30 year mortgage, and jump into a rate more than twice as high, and a higher mortgage if they are thinking of selling and buying a house.
That’s why listing are down. See the chart below for a good visual. As you can see, we are down over 1/3 in listing compared to 3 years, and 5 years ago while at the same time, buyer demand seems to not have decreased one bit in spite of affordability challenges.
San Bernardino County Active Listings
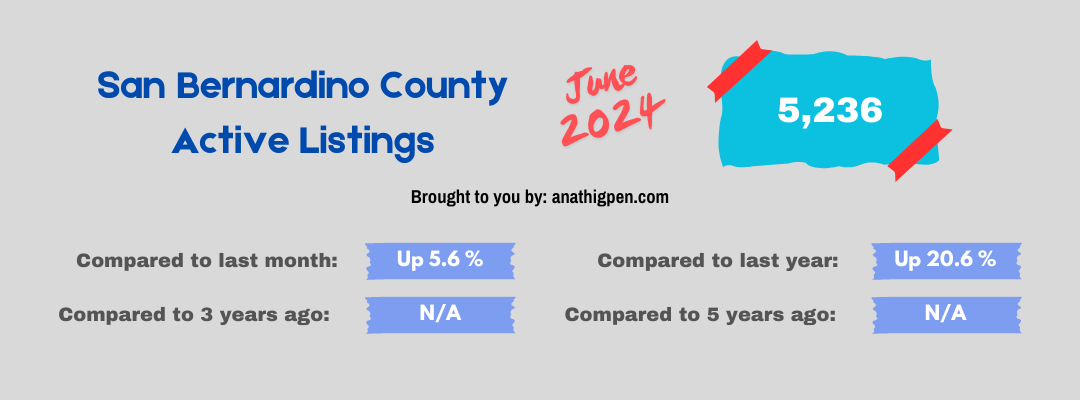
Now let’s take a look at how many active listings were available for buyers to choose from. In June 2024, there were around 5,236 active listings on average for the month in San Bernardino County. It seems like good news for home buyers as there are more options compared to the previous month and the same time last year.
We have data for 3 and 5 years, but we’re not sharing it because we’re not confident about its accuracy for this area and time. It’s a bit odd, but we want to make sure we’re providing only the best info.
San Bernardino County Pending Sales
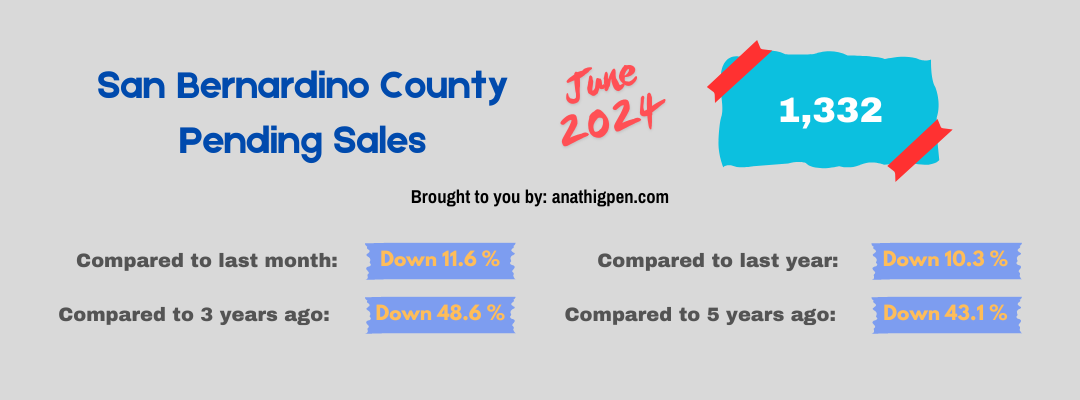
The number of monthly pending sales is an indicator of buyer demand, showing their interest in buying homes at a specific time. In June 2024, there were 1,333 pending sales, representing homes that went into contract during that month.
It is noticeable that there has been a consistent decrease in the percentage change over the past 5 years. Our data indicates that pending sales are down by 44% compared to the historical average for the month of June, which typically sees about 2,400 pending sales. It is apparent that pending sales are struggling in San Bernardino County when considering historical data and the past 5 years.
However, it is necessary to provide context. As mentioned previously, there are various factors contributing to the slowdown in pending sales. The primary factor is the lack of available inventory. To a lesser extent, the current mortgage rates, which are now more than twice what they were 3 years ago, are also contributing to the decrease in pending sales.
Nevertheless, it is important to note that there is still strong demand from people who have both the desire and financial means to purchase a house in San Bernardino County. Personally, I have observed that when I list a home for sale, it sells within days with multiple offers and serious bidding wars.
San Bernardino County Closed Sales
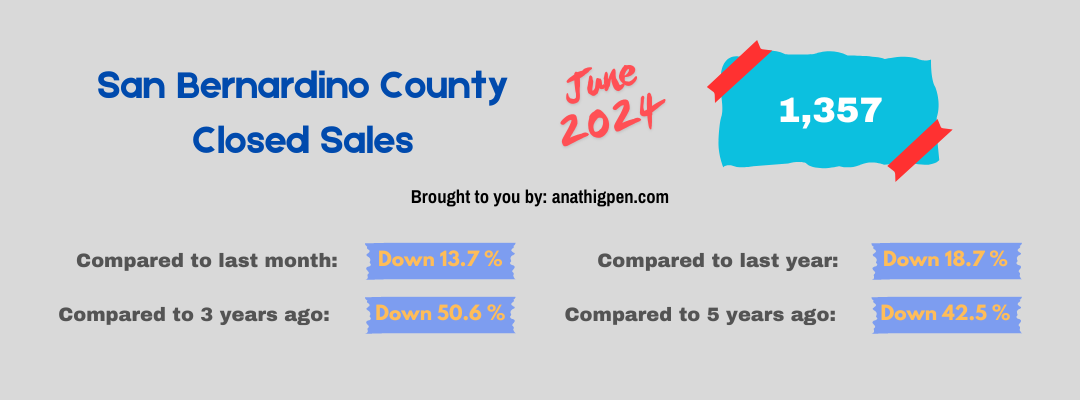
Pending sales naturally leads to closed sales. The month of June there were 1,357 closed sales in San Bernardino County. You can see that the trend for closed sales, as id for pending sales, is down. No surprise there, the percentage change for closed sales basically mirror pending sales.
San Bernardino County Average Days On The Market
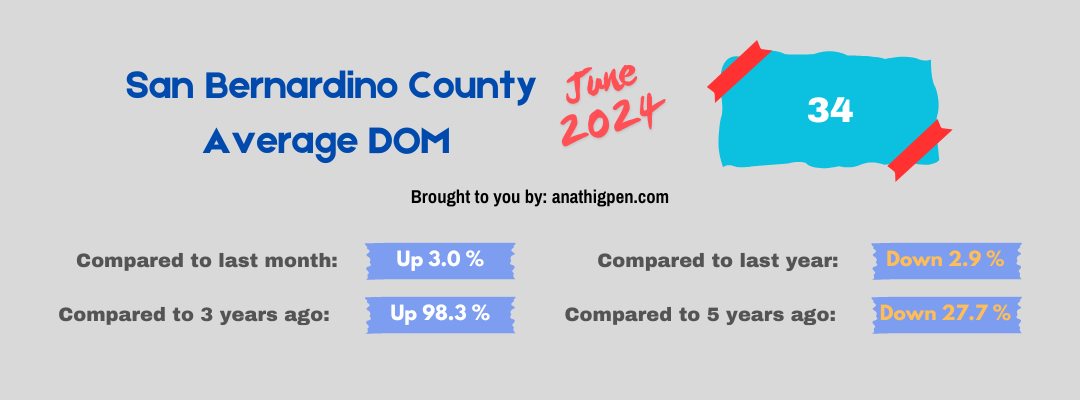
The average days on the market is a strong indicator of buyer demand compared to available inventory of homes for sale. It is an established fact that any market in which homes sell in 90 days or less, it is a sellers’ market. If you live in the Inland Empire, you are familiar with how fast homes sell. In June of 2024, homes in San Bernardino County sold on the average in 34 days.
Historically, over the past 16 years, we show homes selling in 56 days in the month of June. We are looking at homes selling 40% faster than the average June. Suffice it to say, it’s a seller’s market, it’s been like that for many years and it is unlikely to change anytime soon unless something drastic happens.
San Bernardino County Month’s Supply of Inventory
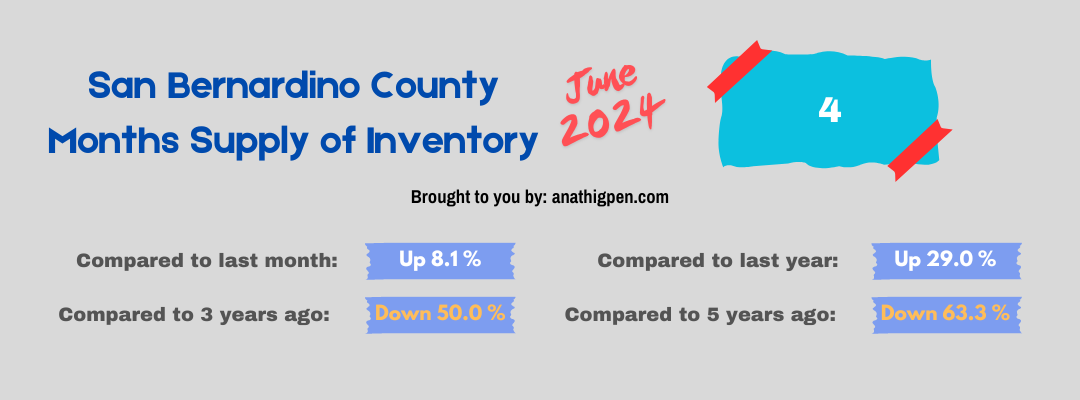
Month’s Supply of Inventory indicates how many months it would take to sell all the available homes at the current rate of sales. If there is less than 3 months of inventory, it’s considered a seller’s market.
In June 2024, there was a 4-month supply of inventory, which is slightly up from the previous month and about 30% higher from last year. This doesn’t drastically change the market from a seller’s market to a buyer’s market, but it does give buyers more options and potentially more room to negotiate prices in certain segments of the market.
Summary
Wrapping up our June 2024 real estate update for San Bernardino County, here’s what you need to know: the market is showing both challenges and opportunities.
Home prices have risen to an average of $588,900, reflecting steady growth and continued demand. New listings are down by 30% compared to three years ago, largely due to homeowners holding onto low mortgage rates. However, active listings have increased by 5.6% from last month, providing more options for buyers.
Pending and closed sales have decreased, with pending sales down 44% from historical averages. This decline is mainly driven by limited inventory and higher mortgage rates, yet strong buyer interest persists. Homes are selling quickly, averaging just 34 days on the market, reinforcing the fact that it’s still a seller’s market.
There’s a slight increase in the month’s supply of inventory to four months, giving buyers a bit more negotiating power but not shifting the market balance significantly.
In short, San Bernardino County’s real estate market remains active and competitive. Whether you’re buying or selling, staying informed and understanding these trends will help you navigate your next steps with confidence.
Have questions? I have answers! If you want to know how these market statistics may apply to you specifically, I am here to help. I’ve been listing and selling homes in the Inland Empire for over 15 years, I know the local market inside and out. Feel free to contact me via phone, text, or email. Happy to be your local real estate guide.


